
How to Measure Customer Support Quality: KPIs Every Business Should Track
Most customer support teams track too many metrics and act on too few. According to BlueTweak’s 2026 analysis of customer service operations, most teams are monitoring 20 to 30 metrics, but when asked what they actually changed last quarter based on that data, the room goes quiet. This guide covers the eight customer support quality KPIs that directly impact retention, cost, and customer satisfaction, with the formula, the 2026 benchmark, and how to act on each one. If you are also evaluating whether to outsource your support function, our complete customer support outsourcing guide covers how to maintain and monitor these metrics with an external team.
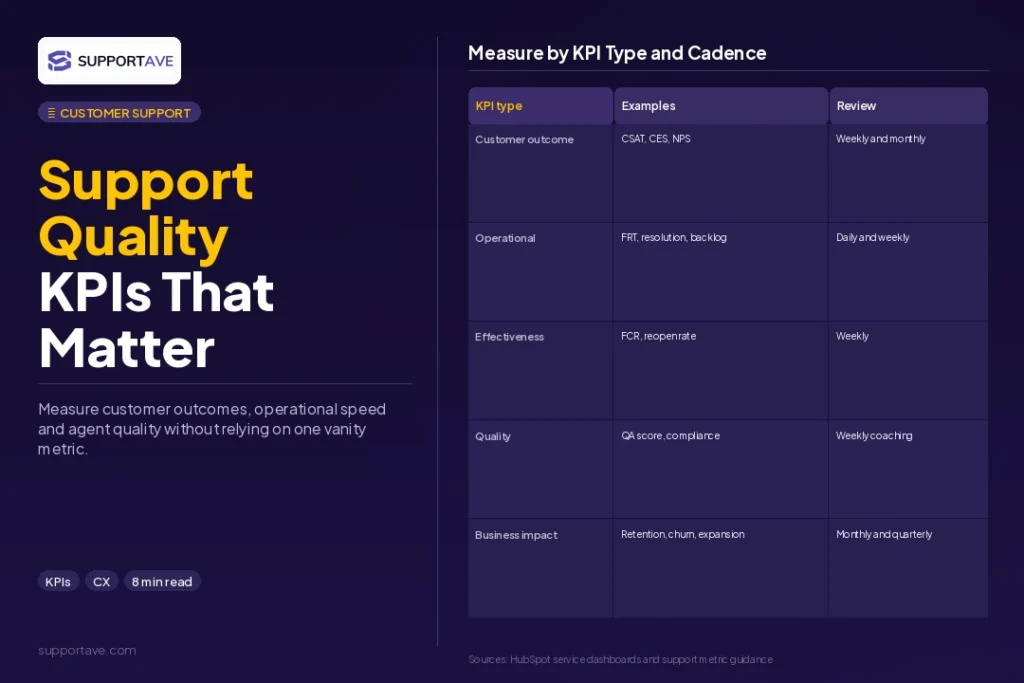
Quick Answer: The eight customer support KPIs that matter most in 2026 are: CSAT, NPS, First Contact Resolution, First Response Time, Average Handle Time, Customer Effort Score, ticket reopen rate, and cost per resolution. According to Lorikeet’s 2026 benchmarks, industry targets are 85%+ CSAT, 70%+ FCR, and under 1 minute first response time for live chat. Start with five: CSAT, NPS, FCR, First Response Time, and Customer Effort Score. Add the others as your operation matures.
Why Most Support Teams Track the Wrong Metrics
Ticket volume is the most commonly reported support metric. It is also among the least actionable. High ticket volume tells you customers are contacting you. It does not tell you why, whether they got help, or how the interaction affected their likelihood of staying.
The metrics worth tracking are those with a direct, documented connection to business outcomes: customer retention, word-of-mouth, and operational cost. Every metric in this guide meets that standard. The ones that do not, ticket volume without resolution context, agent utilisation without quality scores, response counts without sentiment: these are noise that makes dashboards look full and decisions harder to make.
The Customer Support Quality KPIs That Drive Real Decisions
1. CSAT — Customer Satisfaction Score
What it measures: customer satisfaction with a specific interaction, collected immediately after a ticket is resolved.
Formula: CSAT = (Number of positive responses / Total responses) x 100
2026 benchmark: 85%+ is the industry target according to Lorikeet and SQM Group. A score below 80% consistently indicates a systemic quality or training problem.
How to act on it: CSAT is a lagging indicator. When it drops, the problem already happened. Use CSAT to confirm the direction of your quality trends rather than as a day-to-day management tool. Segment CSAT by channel, agent, and ticket type to identify where quality is falling short.
- CSAT under 80%: audit the lowest-scoring tickets. Common causes are slow resolution, agent knowledge gaps, or policy friction the customer experienced as unfair.
- CSAT above 90%: check whether your survey response rate is representative. High CSAT with a low response rate (under 15%) may reflect selection bias: only satisfied customers are completing the survey.
2. NPS — Net Promoter Score
What it measures: customer loyalty and likelihood of recommending your business to others.
Formula: NPS = % Promoters (score 9 to 10) minus % Detractors (score 0 to 6)
2026 benchmark: B2C averages sit at 49 according to Forrester. B2B SaaS averages at 38. A score above 30 for B2C and above 20 for B2B is generally considered healthy. NPS fell in 20 out of 39 industry-country combinations in 2025, per Forrester, as customer expectations outpaced service improvements.
How to act on it: NPS is a quarterly metric, not a weekly one. Use it to track brand-level loyalty over time, not individual interaction quality. Act immediately on Detractors: personal follow-up within 24 hours of a 0 to 6 score converts approximately 30% of detractors when handled well.
3. FCR — First Contact Resolution
What it measures: the percentage of tickets fully resolved in a single interaction, without the customer needing to follow up.
Formula: FCR = (Tickets resolved on first contact / Total tickets) x 100
2026 benchmark: SQM Group puts the average FCR at 70%, with top performers reaching 85%. FCR is the single strongest predictor of CSAT. Research from SQM Group shows a 1-point improvement in FCR corresponds to approximately a 1-point improvement in CSAT.
How to act on it: low FCR almost always points to one of three problems: agents lack the authority to resolve issues without escalation, agents lack the product knowledge to resolve issues confidently, or the ticket routing system is sending queries to the wrong tier. Address the root cause rather than pressuring agents to close tickets faster.
4. FRT — First Response Time
What it measures: the time between a customer sending a support request and receiving a first human response. Automated acknowledgements do not count.
2026 benchmarks: under 1 minute for live chat, under 1 hour for email (urgent), under 2 hours for email (standard). According to RethinkCX’s 2026 KPI guide, speed is the number one driver of customer satisfaction.
How to act on it: FRT is a leading indicator. It predicts CSAT before the survey is sent. Monitor FRT daily for live chat and weekly for email. Rising FRT without a corresponding increase in ticket volume signals a staffing or routing problem, not a volume problem.
If your FRT is regularly exceeding these benchmarks, our 24/7 customer support guide covers the cost comparison of extending coverage hours through outsourcing versus in-house staffing.
5. AHT — Average Handle Time
What it measures: the average time an agent spends on a ticket from opening to resolution, including any follow-up or wrap-up time.
2026 benchmark: 4 to 7 minutes for voice; 8 to 15 minutes for email depending on complexity; 2 to 5 minutes for chat. AHT benchmarks vary significantly by industry and ticket complexity.
How to act on it: AHT only makes sense alongside quality metrics. Falling AHT with falling CSAT means agents are closing tickets too quickly without resolving them. Falling AHT with stable or improving CSAT means efficiency has genuinely improved. Never optimise for AHT in isolation. The ticket reopen rate is the check on whether low AHT reflects quality or just speed.
6. CES — Customer Effort Score
What it measures: how easy the customer found it to get their issue resolved.
Survey question: ‘The company made it easy for me to handle my issue.’ (1 to 7 scale, lower effort is better.)
2026 benchmark: a CES below 3 on a 7-point scale (where 1 is strongly agree that it was easy) is the target. According to Gartner, 96% of high-effort customer experiences result in disloyalty. CES is a stronger predictor of churn than CSAT in many B2B contexts.
How to act on it: high effort scores typically point to specific friction in the support journey: being transferred multiple times, having to repeat information across contacts, or needing to use multiple channels to resolve one issue. Map the steps customers take before resolution and identify where friction accumulates.
7. Ticket Reopen Rate
What it measures: the percentage of tickets marked as resolved that are subsequently reopened because the issue was not actually fixed.
Formula: Reopen Rate = (Reopened tickets / Total resolved tickets) x 100
2026 benchmark: under 5% is healthy. Above 10% is a systemic quality problem that will show up in CSAT and churn data within weeks.
How to act on it: high reopen rates almost always indicate agents are closing tickets prematurely under time pressure, or that the resolution provided was technically correct but did not actually solve the customer’s underlying problem. Pull a sample of reopened tickets and look for patterns in the original resolution: was it unclear, incomplete, or did it address the symptom rather than the cause?
8. Cost Per Resolution
What it measures: the total cost of resolving one support ticket, including agent time, tooling, and management overhead.
Formula: Cost per Resolution = Total support costs / Total tickets resolved
Why it matters: Lorikeet’s 2026 analysis identifies cost per resolution as the true efficiency metric for support operations, because it accounts for repeat contacts that inflate ticket counts without adding value. A team with a lower cost per ticket but a 20% reopen rate is not cheaper than a team with a higher per-ticket cost and a 4% reopen rate.
This metric is particularly relevant if you are evaluating outsourcing. Our email support outsourcing guide includes the cost comparison between in-house and outsourced operations at different ticket volume levels.
How to Start Tracking These Metrics
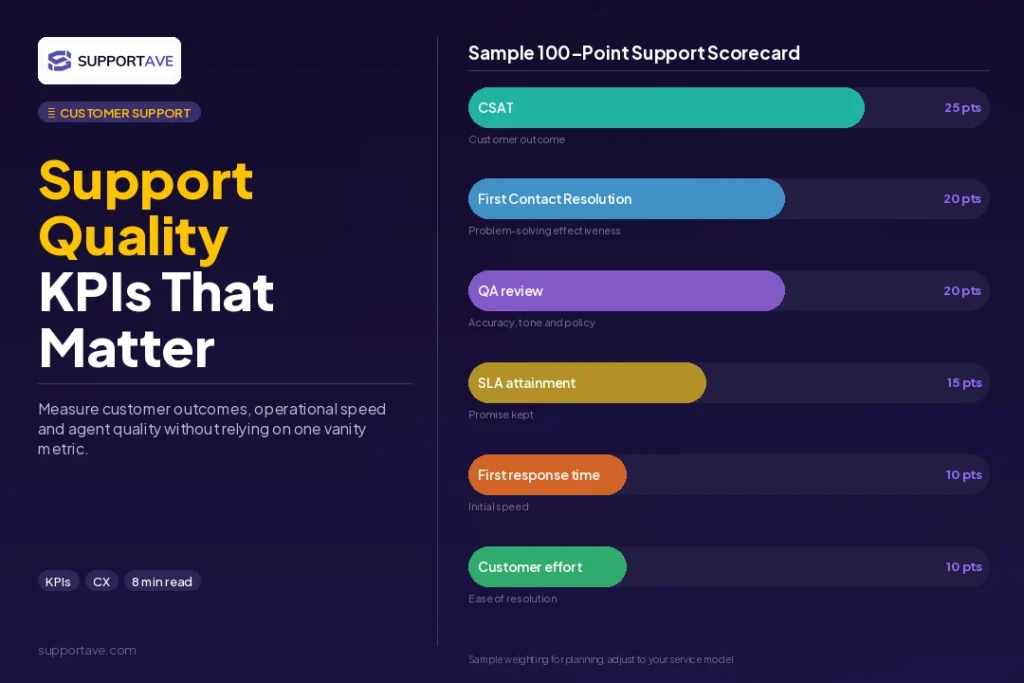
If you are tracking none of these today, start with five rather than all eight. Pick metrics that connect to your current business priority:
- Retention focus: CSAT, NPS, CES, and Reopen Rate. These are the metrics most directly connected to whether customers stay.
- Efficiency focus: FCR, AHT, FRT, and Cost per Resolution. These drive operational cost and identify where process improvements have the most impact.
- Quality assessment: CSAT, FCR, and Reopen Rate. Three metrics that together tell you whether your team is actually resolving issues or managing ticket counts.
Set baselines before setting targets. Benchmark your own current performance across these metrics for 30 days before comparing to industry averages. A team that has never measured FCR should not set an 85% FCR target in week one. The value of tracking is in the trend, not the absolute number relative to an industry average.
Frequently Asked Questions
What is the difference between CSAT and NPS?
CSAT measures transactional satisfaction: how did a specific interaction go? NPS measures relational loyalty: would you recommend us to someone you know? CSAT is collected immediately after a ticket closes and reflects the quality of that specific interaction. NPS is collected periodically (quarterly or semi-annually) and reflects the customer’s overall view of the business. Use CSAT for tactical quality management and NPS for strategic retention planning. A customer can give a 5/5 CSAT on a support interaction and still churn three months later if the product fails to deliver value.
How often should I review customer support KPIs?
Operational metrics like FRT and AHT should be reviewed daily or weekly to catch staffing and routing problems before they affect CSAT. Quality metrics like CSAT, FCR, and Reopen Rate should be reviewed weekly or bi-weekly. Strategic metrics like NPS and Cost per Resolution should be reviewed monthly or quarterly, as they are better for identifying trends than daily fluctuations. Overly frequent review of NPS, for example, creates noise from statistical variance rather than insight.
What tools can I use to track these metrics automatically?
Most modern helpdesk platforms calculate the majority of these metrics automatically. Zendesk, Gorgias, Intercom, and Freshdesk all provide built-in dashboards covering CSAT, FRT, AHT, and ticket volume. Reopen rate typically requires a custom report in most platforms. NPS and CES usually require a separate survey tool (Delighted, SurveyMonkey, or built-in NPS modules in Zendesk and Intercom). Cost per Resolution requires combining your helpdesk data with your staffing cost data, typically done in a spreadsheet or BI tool.
Is a high CSAT score always a good sign?
Not necessarily. High CSAT with a low survey response rate may reflect selection bias: only satisfied customers complete surveys. High CSAT with a high reopen rate means tickets are being closed prematurely with customers rating the interaction positively before discovering the issue was not actually resolved. Always read CSAT alongside reopen rate and response rate to get an accurate picture of quality.
What should I do if my FCR is consistently below 70%?
First, check whether your FCR calculation is accurate: are you counting tickets where the customer responded to say thank you as reopens? That would artificially suppress your FCR. If the calculation is correct, audit a sample of tickets that required multiple contacts and identify the pattern. Is it agents lacking authority to make decisions? Knowledge gaps on specific product areas? Or a routing problem sending tickets to the wrong tier? Each has a different solution, and none of them is ‘tell agents to close faster’.
Supportave’s customer support services include structured QA programmes and KPI reporting so you can see exactly how your support operation is performing. See our website chat support, email support, and call support services, or contact us to discuss your requirements.